Q&A with a Global Supply and Logistics Expert on the Impact of COVID-19 - Seton Hall University
Tuesday, April 7, 2020

Professor Penina Orenstein
As the world attempts to navigate the uncertain conditions surrounding COVID-19, businesses, medical professionals and government officials have all struggled to maintain appropriate levels of goods — and the services that require those goods. Whether ventilators and N95 masks or toilet paper and chicken, the supply chain has struggled to keep up with demand. Stillman School of Business where she teaches both undergraduate and MBA-level courses in Quantitative Methods for Business and Supply Chain Management. She recently addressed the significant role of supply networks during this time and the impact upon the supply chain in the midst of COVID-19.
In a recent article in The Atlantic, Institute for Supply Management CEO Tom Derry shared that the grocery supply chain is remarkably robust. What concerns should the average American have about the grocery supply chain today? 3 months from now? Longer term?
Orenstein: The grocery supply chain is a robust operation until panic sets in. And currently food demand in retail locations is at "unprecedented levels," and to the extent that we see food shortages it is largely a function of "panic buying."
However, the grocery supply chain has built in mechanisms for disruption. The question is can we re-distribute the supply to those that need it. Restaurants no longer need their regular deliveries; can these groceries be re-directed to individual homes? If the situation persists, food that had been shipped to cruise lines, airlines and restaurants could instead be sent to grocery stores and retailers.
Supply chain management is concerned with the efficient integration of suppliers, factories, warehouses and stores so that merchandise is produced and distributed in the right quantities, to the right locations and at the right time. The question in a COVID-19 environment is "what is right?" How much should be produced if there is panic buying, what are the locations that are now priority and what is the timeframe? As long as farmers are still farming, truckers driving, packages are being packaged, and therefore delivered, you still have a supply chain. As soon as there is a shutdown for any of these aspects, the supply chain will crumble unless steps can be taken to offer viable substitutes. From a COVID-19 perspective, however, we are initially looking at re-tooling the supply chain. As time goes on and there is a shutdown in the labor force, it is likely that the supply chain structure can fail. The key is to keep all supply chain participants operational.
A few years ago, you published a paper on the "key drivers of future supply chains?" What are the key drivers pre vs. post COVID-19?
Orenstein: The key drivers that were identified in the paper were: big data giving way to fast data, social media, and knowledge workers.
Post Covid-19
A key part of big data is not only data collection, but also data interpretation or
analytics which highlights a growing need for a talent to interpret the data and make
effective decisions. The need for knowledge workers to analyze the data is ever more
critical. Social media is a way of distributing key information and again, during
a crisis, the role of social media can be extremely important. There is clearly going
to be a demand for an ability to understand the responsiveness of the supply chain.
Supply chains that are elastic in nature and can re-tool to cope with the unprecedented
demand and changes are going to be successful. Those supply chains with efficient
models for distribution will emerge as leaders. Essentially, the existing supply chain
has to be "re-allocated," and since we are dealing with out of the normal behaviors,
this might pose a challenge. We also do not have a lot of time to analyze the trends
as they are constantly shifting in response to the behaviors. Eventually over time,
as long as farmers keep farming, truckers keep trucking and manufacturers produce,
the supply chain will reach an equilibrium.
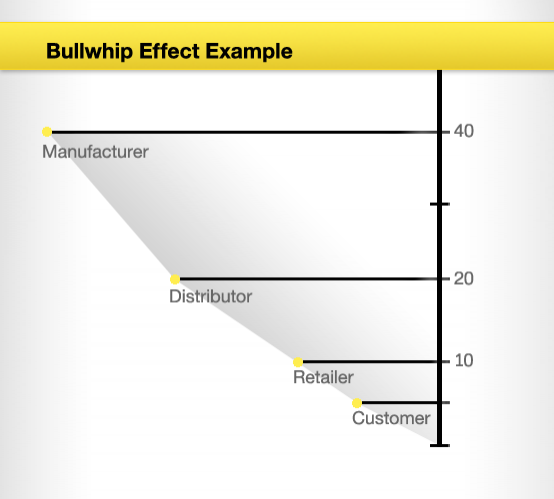
Related to this is communication in the supply chain. As people rush to buy food and other nonperishable items, the big consumer goods companies are trying to meet demand without needlessly ratcheting up production. Ratcheting up production is another way of introducing the "bullwhip effect." The bullwhip effect occurs when orders sent to the manufacturers and suppliers create larger variances or "waves" than the sales to the end customer. This variance can have a negative impact on the smoothness of the supply chain process as each link of the supply chain will over or underestimate the product demand resulting in exaggerated fluctuations1.
In Figure 1, we see a numerical example of the bullwhip effect. In this case, the customer demand is only 8 units. However, the retailer orders 2 extra units so that they do not run out of stock. The supplier orders 20 units so they have enough stock to guarantee timely shipment of goods to the retailer. The manufacturer then does the same and orders 40 units from their supplier in bulk to ensure economies of scale. The end result is 40 units produced to an actual customer demand of only 8 units:

Figure 1: Bullwhip effect example
By remaining in constant contact with manufactures and suppliers, one can ensure that products will keep moving efficiently through the supply chain and there will not be an excess build up. People only need so much paper towels or shelf-stable goods. Eventually, they start shopping in their own basement supplies rather than shopping for more in stores, and demand will fall. Companies have to be mindful of hiring more staff to ramp up production.
How will visualization software help the supply networks of tomorrow?
Orenstein: To think of how a supply chain works — think about it — not as a sequential chain but as a network. In a supply network, if one supplier is unable to supply (fire in the warehouse), there are alternative suppliers to turn to. If one path/link goes bad, there are alternative paths. This is why network visualization might be helpful in this context. If one can see the extent of alternate paths, one can determine the robustness of that supply chain.
We're told that in the first few weeks of January 2020, companies that had mapped their supply chain already knew which parts and raw materials were originating in the Wuhan and Hubei areas and, as a result, could bypass the frantic hunt for information and fast-track their responses. Is a robust supplier-monitoring system that maps sub-tier dependencies a basic requirement for today's supply chain and sourcing professionals? In addition, if this is true, how can those without this current capability begin to garner it?
Orenstein: This is a fascinating observation and I would say it is absolutely true. But I word rephrase it slightly to state that: a robust supplier-monitoring system that maps sub-tier dependencies is a basic requirement for today's supply networks and sourcing professionals. I say this because we are not dealing so much with a chain when it comes to looking at sub-tier dependencies but a complex network web. And in these instances, multi-layered and complex, the need for visualization tools is ever more apparent.
Incidentally, my own research is in this area. It maps out the tiered supply network (Orenstein P., 2020, "The changing landscape of supply chain networks: an empirical analysis of topological structure," Journal of Information Systems and Operations Research, submitted March 2020). My data is obviously all pre COVID-19. It would be fascinating to do a before and after study and identify which supply chains are resilient to disruptions in being able to re-tool.


Figure 2a-b. Topological structure of the (a) Home Depot (HD) and (b) Lowes (LOW) supply networks,
2014, (Tiers 1-2) Source: Bloomberg
Your most recent research collected data to visualize a series of supply networks (including the retail sector, Amazon, and the like, developing an algorithm which ranks the suppliers by their connectedness. What can this tell us about the strengths and weaknesses of the Supply Chain and particular sectors and companies within it.
Orenstein: I have been working with an exceptional undergraduate student, Anniek Jansen, who has added another dimension to supply network visualization (Orenstein, P. and Jansen, A., 2020, "A data-driven analysis of degree centrality and supply chain network structure," in progress). Ms. Jansen has developed an algorithm which can be applied to any number of supply networks. The algorithm essentially provides a ranking of the key suppliers in the tiered network of suppliers. The suppliers that are most well-connected emerge as key operators in the ranked list of suppliers. These can be viewed as critical to the supply network operation. If anything happens to these key suppliers, the network will fail. Thus, we can see who the critical suppliers are in the supply chain network and compare how things are changing over time. Of course, it would be wonderful if we had post COVID-19 data but we do not. But, at any rate we can show why it is important to get this information in that knowing who the key suppliers are can help determine the resilience of a supply chain when a disruption occurs. And given the disruptions to the supply networks that we're now experiencing due to COVID-19, with the appropriate funding we will now be able to compare this data and the visualization modeling with the outcomes of this disruption as it become available to show the impact of connectedness (and the lack thereof) on the supply chain. Thus, in showing the weakness and vulnerability to disruption it can give organizations the ability to adjust accordingly and build in resilience for the future.
Lastly, please ask yourself a question that you would like to answer.
Orenstein: I would like to examine the responsiveness of supply networks on a large scale pre and post COVID-19. I have the visualizations and ranked suppliers for pre- COVID 19. What does the picture look like as a result of the global pandemic?
Penina Orenstein, Ph.D. Associate Professor, Department of Computing and Decision
Sciences, Seton Hall University, Stillman School of Business
Hired in 2006, Stillman School of Business, where she teaches both undergraduate and graduate courses, Quantitative Methods
for Business and Supply Chain Management. Dr. Orenstein has introduced an undergraduate
certificate in Supply Chain Management and has been responsible for the creation and
deployment of a new concentration in Supply Chain Management at the MBA level. Her
research focus is on the topological structure of supply networks. Her research has
appeared in the Journal of Networks and Spatial Economics and Wireless Personal Communications. She has also presented her work at various conferences including POMS, INFORMS, MSOM
and the SCMA. In 2016, her research idea on the topological structure of supply networks
attracted international attention by winning the 2016 Best Paper Award at SCMA 2016.
In 2018, she won the University Research Council award for her work on digital mapping
of supply chain networks.


